McKinsey Solve Walkthrough: We've Helped 500,000+ Candidates Prepare, Here's How
In the past 18 months, over half a million people have watched our McKinsey Solve tutorials, and more than 1,300 candidates have used Prepmatter’s Solve simulation to prepare. Our simulation has a 98% success rate, with users consistently scoring in the top 25% of all test takers, which we understand is McKinsey’s benchmark.
In this guide, you'll learn what McKinsey Solve is and why it matters, the complete structure of all 3 games (Redrock Study, Sea Wolf, Ecosystem Creation), what actually changed in July 2025 and what’s now outdated, step-by-step strategies for each game with examples, how McKinsey scores you with their dual product and process system, how to prepare effectively despite what McKinsey says, what happens after you take the test, and how to practice with realistic simulations.
McKinsey Solve Quick Facts:
- What it is: Digital gamified assessment with 3 mini-games testing cognitive abilities
- Duration: 65 minutes total (35 min Redrock + 30 min Sea Wolf)
- Games included: Redrock Study (data analysis), Sea Wolf (microbe selection), Ecosystem Creation (food chain - phased out)
- Scoring method: Both your answers (product) and your process (how you got there)
- Stakes: Screens candidates before case interviews with a 70-80% rejection rate
- Can you prepare? Yes, proven by a 98% pass rate with proper prep
Start practicing now with our simulation →
What is McKinsey Solve?
McKinsey Solve, also known as the McKinsey Digital Assessment or McKinsey Problem Solving Game, is an online gamified test that McKinsey & Company uses to screen candidates during early recruitment stages. It replaced the traditional paper-based Problem Solving Test (PST) and evaluates how you think, not what you know about business.
You'll see this same assessment called different things across forums and articles. The McKinsey Solve name is the current official term, but candidates also refer to it as the Problem Solving Game (PSG), the McKinsey Digital Assessment, or the Imbellus Game (after the company that originally developed it). All these names point to the same screening test.
The format is straightforward. You take the test online from your own computer using a browser. McKinsey offers the assessment in multiple languages, and most candidates take it remotely with some form of proctoring. You complete everything in one sitting.
McKinsey used the Problem Solving Test (PST) for years, a written, GMAT-style test with business cases. In 2017, they piloted a new approach with Imbellus, a gaming company, to create a more holistic assessment.
By 2020, this became the standard globally, and it has evolved significantly since then. The timeline shows the progression: pilot testing in select offices during 2017, global rollout as the Imbellus Game by 2019-2020, rebranding as McKinsey Solve in 2022, introduction of Redrock Study in 2023, Sea Wolf piloting throughout 2024, and finally the July 2025 phase-out of Ecosystem Creation, making Sea Wolf the standard second game.
McKinsey created this assessment for several reasons. Scale matters when you need to interview thousands of candidates globally without flying consultants around the world. Fairness was another driver; the old PST favored business majors who had studied financial statements and market analysis.
The new format tests cognitive abilities that anyone can develop. Cost efficiency plays a role, too, with automated scoring replacing physical test centers and manual grading. McKinsey also claims better predictive validity, stronger correlation between Solve performance and actual consulting success.
Most candidates invited after the resume screen take McKinsey Solve. Exceptions are rare and usually limited to senior hires or cases with strong internal referrals, depending on the office. The assessment applies to almost every consulting role: generalist, Digital, implementation, and specialist. If you’re applying for a consulting position at McKinsey, expect to take Solve.
How McKinsey Solve Fits Into the Recruitment Process
The flow moves like this: First, you submit your resume and cover letter. Within 1-2 weeks, McKinsey conducts an initial screen. This screen filters out obvious mismatches, fake applicants, completely unqualified candidates, totally botched resumes, but most applicants who apply seriously get invited to Solve.
After the screen, you receive your McKinsey Solve invitation. You typically get a 1-2 week window to complete the test at a time that works for you. Once you finish, McKinsey takes another 1-2 weeks to evaluate both your Solve performance and conduct a deeper resume review. This is where roughly 70-80% of candidates get rejected. Only about 20-30% receive interview invitations.
Those who advance move to case interviews: a first round with 2-3 case and fit interviews, then a final round with 2-3 more interviews, often with partners. Finally, offers go out to successful candidates.
One critical point: you need great Solve scores and a great resume to advance. Neither alone will carry you through. We've seen excellent candidates with strong academic backgrounds rejected for poor Solve performance. We've also seen candidates with outstanding Solve scores rejected because their resumes, under closer inspection, revealed gaps in relevant experience or poor communication skills.
Perfect your resume before Solve with our free Secure the Interview course
When McKinsey cuts more than 70% of candidates based on this single test, the stakes are high. You only get one attempt every 12 months, so a failed test means a full year’s delay in your application timeline. And because McKinsey roles often lead to strong compensation, bonuses, and exit opportunities, the opportunity cost is significant.
That's why, despite McKinsey suggesting no preparation is needed, 98% of our students who prepare properly score in the top 25%. The difference? They understood what the test evaluates and practiced the right skills.
McKinsey Solve Structure: What's New
As of July 2025, McKinsey Solve consists of two core parts: Redrock Study and Sea Wolf. The Ecosystem Creation game, which many candidates encountered in previous years, has been phased out globally. It remains available in our simulation as bonus practice in case McKinsey reintroduces it, but you should not expect to see it in your actual assessment.
Watch the complete walkthrough above where we solve both Redrock Study and Sea Wolf scenarios in real-time, explaining every decision.
Part I, Redrock Study (35 Minutes)
Redrock Study is a data-heavy research scenario focused on ecosystem dynamics. You'll analyze a conservation issue, like wolf reintroduction programs affecting vegetation and tourism, then answer questions and build a report. Your objective is to extract insights from written and visual data, perform calculations accurately and efficiently, and answer quantitative and qualitative questions under time pressure.
The gameplay flows through four distinct phases.
Phase 1: Investigation should take about 5 minutes. You'll review a lengthy research article with exhibits showing charts and tables. Your job is to drag key data points into your Research Journal. The game tracks what you select, so this affects your process score. You’ll see multiple exhibits. For example, in our simulation, these include bar charts on wolf populations, tables with vegetation coverage, and tourism revenue projections. Your job is to focus on what’s relevant to the stated research objective rather than reading everything.
During this phase, you can see the full case description with all supporting data divided into three sections: the objective (what you're trying to solve), exhibits (visual data like charts and graphs), and study information (written context and numerical details).
The data comes in two formats. Text-based data includes movable data points (case objectives and calculation instructions that clarify the goal) and non-movable data points (background information that provides context but doesn't need collecting). Number-based data typically consists of movable data points, the majority of what you'll collect, found in charts, diagrams, or within the text itself.
You can drag any movable data point into the Research Journal. Each collected piece appears as a card with its own name and description. The data in your journal can then be used in the calculator or as answers in Phase 2. Change the default labels if they're not descriptive enough. Using the right labels makes your analysis faster because you'll easily find important data later.
Phase 2: Analysis should take about 10 minutes. You'll answer 3 quantitative questions based on collected data. Each question has sub-questions requiring calculations. Use the built-in digital calculator; this matters for your process score. Drag answers to your Research Journal for later use.
The math itself stays straightforward, basic arithmetic, percentages, and compound growth rates. The complexity comes from layered questions. For example: "If 150 wolves each consume 500 hares per year, and the hare population grows at 10% annually, in which year will the population drop below 300,000?" You'll need to calculate iteratively across multiple years.
The calculator features a straightforward interface, resembling a digital calculator found on a phone, and includes basic operators: multiplication, addition, subtraction, and division. We advise you to perform all calculations using the provided calculator, as all your actions are documented in a history log. It's safe to assume that the process you follow to arrive at the answers will also affect the final results.
The calculations required fall into two categories. Basic operations include addition, subtraction, multiplication, and division. While these operations are fundamental, you may need to use them in combination to perform more complex calculations. Percentages, ratios, and fractions address questions about relationships, percentage differences, growth rates, and related concepts.
Strengthen your math skills with our practice drills
Phase 3: Report should take about 5 minutes total, split between written and visual components. The written report involves filling in blanks in a pre-written summary using your calculated answers. The visual report requires selecting an appropriate chart type (bar, line, or pie) and inputting data to create a visualization.
The report phase is where your earlier work pays off. If you collected the right data in the Investigation and calculated correctly in the Analysis, this phase moves quickly. The challenge comes in choosing the right chart type. Use bar charts to compare categories (e.g., vegetation cover across different regions). Use line charts for trends over time (like wolf population change from year 0 to year 5). Use pie charts for parts of a whole shown as percentages (like budget allocation across 3 programs totaling 100%).
Phase 4: Mini Cases should take your remaining 15 minutes. You'll face 6 short, independent questions not directly connected to the main study but thematically related. These are extremely time-pressured, at roughly 2-3 minutes per case.
Question types break down into four categories. Word problems give you a scenario with numbers and ask for a calculation. Formula selection describes a situation and asks which formula applies. Verbal reasoning uses multiple choice to assess if a statement is true based on data. Visualization asks which chart type best represents the given data.
These mini cases test your ability to process new information quickly. You might see a conservation funding scenario asking you to calculate which project introduces the most plant species per dollar spent. There isn’t time to overthink; read the data, run the numbers, pick an answer, and move on.
Practice Redrock scenarios with our simulation, updated weekly with new cases
Part II, Sea Wolf (Ocean Cleanup) (30 Minutes)
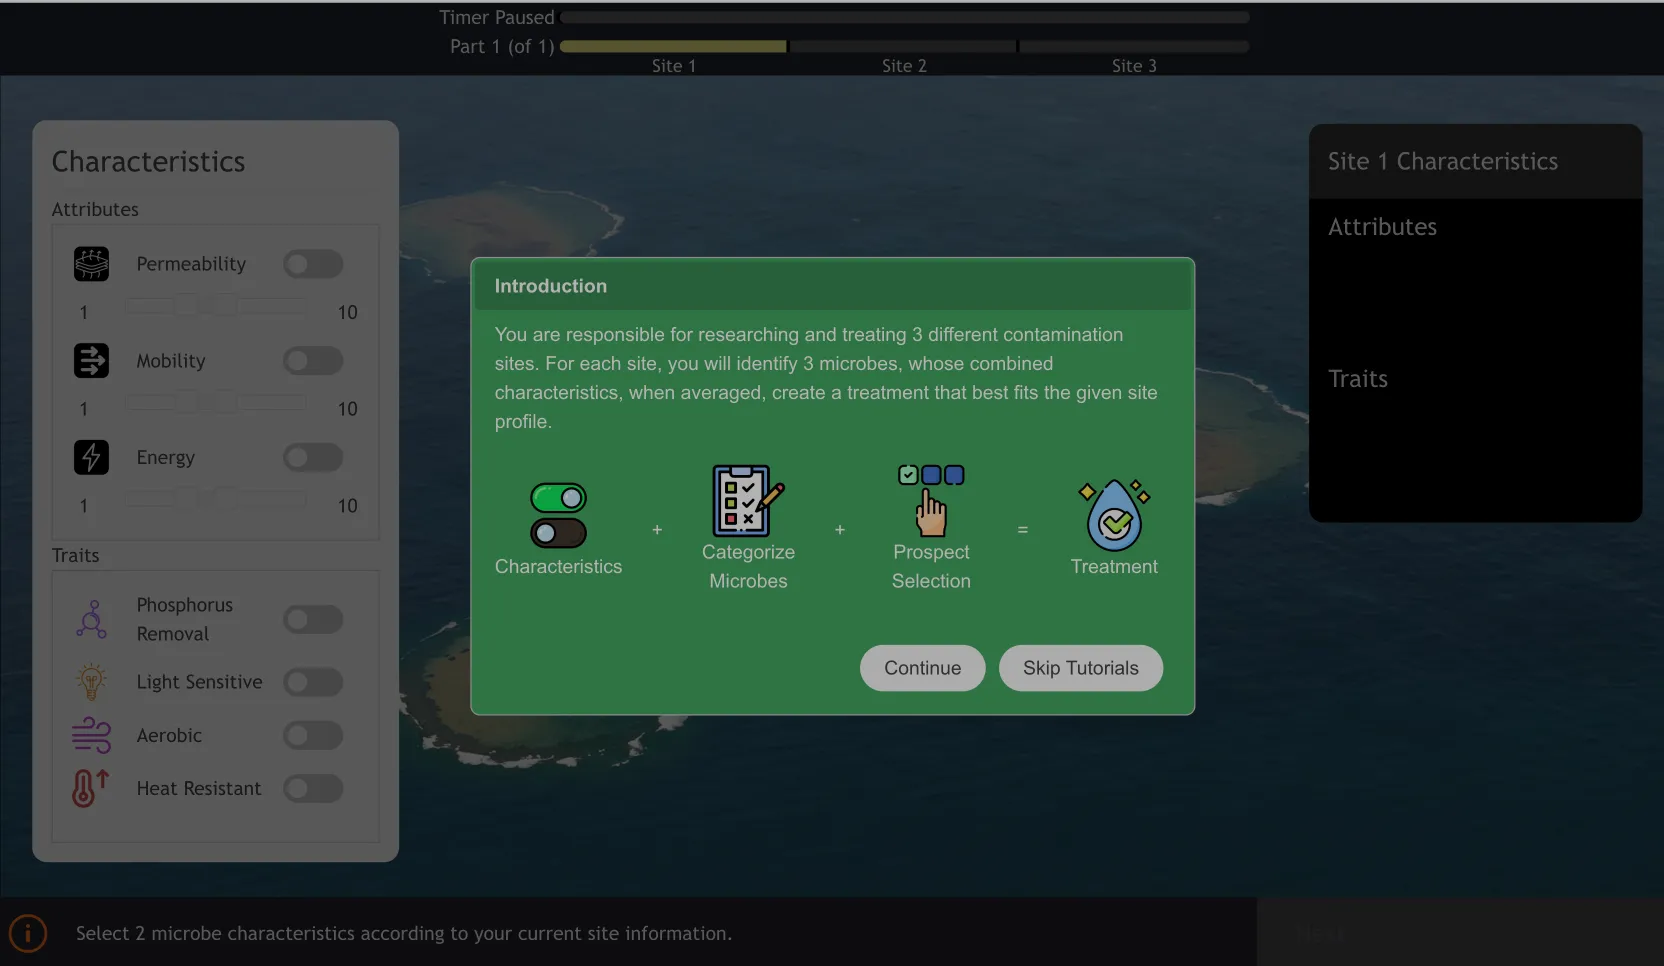
Sea Wolf, the newest addition to McKinsey Solve, challenges you to treat contaminated ocean sites by selecting the right microbes. Each site has specific environmental conditions and pollution types, and you'll need to match microbe attributes and traits to site requirements.
Your objective is to combine microbes and maximize treatment effectiveness based on their averaged attributes and collective traits across 3 different contamination sites.
Before we dive into gameplay, you need to understand key concepts. Characteristics apply to both sites and microbes. Attributes are 3 numerical values on a 1-10 scale, like permeability, mobility, and energy. Traits are binary characteristics like aerobic, heat-resistant, or phosphorus removal.
Each contaminated site shows target ranges for each attribute (permeability 3-5, mobility 7-9, for example), one desirable trait you want in your treatment, and one undesirable trait you need to avoid.
Each microbe has 3 attribute values and 1 trait. Your goal is to select 3 microbes whose averaged attributes fall within site ranges, include the desirable trait, and avoid the undesirable trait.
The gameplay flows through 4 tasks per site, repeated for all 3 sites.
Task 1: Set Microbe Characteristics follows a strategy of picking 1 attribute plus 1 trait. Choose an attribute with the most extreme target range (furthest from the midpoint of 5.5) and the desirable trait if shown. This strategy filters the initial pool to include more microbes that meet site requirements, making subsequent tasks easier.
Task 2: Categorize Microbes involves reviewing 10 microbes and assigning each to the current site, the next site, or the return pile. Use the "2 out of 4 rule": if a microbe matches at least 2 requirements (attributes plus trait) and lacks the undesirable trait, assign it to the current site.
For each microbe, check: Do 2 or more of its 3 attributes fall within site ranges? Does it have the desirable trait? Does it lack the undesirable trait? If you get a score of 2 or more points and it lacks the undesirable trait, assign it to the current site. If it has undesired traits but fits the next site, assign it there. Otherwise, return it.
Task 3: Build Prospect Pool happens over 4 rounds of selection. Starting with 6 pre-loaded microbes, select 1 additional microbe from 3 options in each round. Prioritize microbes without undesired traits, then those matching multiple attributes.
The priority hierarchy works like this: First, eliminate undesirable traits. If all 3 options have the undesirable trait, pick the one with the most attributes matching. Otherwise, never pick a microbe with an undesired trait when you have alternatives. Second, count attribute matches. Of the remaining options, pick the microbe with the most attributes in range: 3 out of 3 matches beats 2 out of 3 beats 1 out of 3. Third, consider a desirable trait only when choosing between two microbes with equal attribute matches, and only if you do not already have one in your prospect pool.
Task 4: Submit Final Treatment requires selecting 3 microbes from your 10-microbe pool. Calculate whether their averaged attributes fall within ranges. Make sure at least one has the desirable trait and none have the undesirable trait.
Treatment effectiveness scores out of 100%. You get 60% total (20% per attribute) if each averaged attribute falls within the site range. You get 20% if at least one microbe has the desirable trait. You get another 20% if no microbes have the undesirable trait. In some scenarios, 100% effectiveness becomes impossible given the available microbes. Do not stress if you can only achieve 80%; that may be the maximum achievable score for that particular site.
In our video, we work through a complete Sea Wolf scenario and achieve 100% effectiveness across all three sites by carefully tracking which microbes meet requirements and doing quick mental math to keep average attributes within range. You can watch the full 27-minute Sea Wolf walkthrough on our YouTube channel.
The total time breakdown for the current McKinsey Solve: Redrock Study takes 35 minutes, Sea Wolf takes 30 minutes, for a total of 65 minutes of active gameplay, excluding tutorials. The timer pauses briefly when transitioning between Redrock and Sea Wolf, giving you a moment to breathe and refocus.
Use this time wisely, grab water, stretch, and reset your mindset. Plan your prep around doing full 65-minute runs, not isolated practice. Stamina matters as much as skill.
How McKinsey Scores Your Performance (And Why Process Matters)
What makes McKinsey Solve different from any test you've taken before: McKinsey does not only score your final answers. They score how you arrived at those answers.
Your product score measures the quality of your final outputs.
-
Was your ecosystem sustainable?
-
Were your calculations correct?
-
Did you select effective microbes?
This evaluates the accuracy of answers, the effectiveness of solutions, the quality of final selections, and the logical consistency of outputs.
For Redrock:
-
Did you answer the quantitative questions correctly?
-
Did your written report include accurate data? Did you choose the appropriate chart type?
For Sea Wolf:
-
Did your microbe combinations achieve high treatment effectiveness scores?
-
Did you meet site requirements?
For Ecosystem Creation, if encountered:
-
Did your food chain sustain all 8 species without collapse?
Your process score tracks every action you take during the assessment. McKinsey's software monitors your mouse movements, keystrokes, how long you spend on each section, what data you collect, and how you navigate the interface.
What it evaluates: strategic approach and planning, efficiency of navigation, data prioritization, hypothesis testing patterns, decision consistency, and use of available tools (especially the calculator).
During Redrock's Investigation phase, McKinsey tracks which data points you drag into your Research Journal. Dragging everything may show poor judgment; you did not identify what was truly relevant. Dragging too little may show incomplete analysis. Strategic selection shows consulting thinking.
In the Analysis phase, every calculation you make in the digital calculator gets logged. If you use Excel or do math on paper instead, you lose process credit even if your answers turn out right.
During Sea Wolf, moving back and forth between tasks, changing microbe assignments repeatedly, or selecting randomly without a clear strategy negatively impacts your process score.
Two candidates can arrive at the same correct answer, yet only one may receive an interview invitation. A strong process score often explains the difference. McKinsey looks for structured, hypothesis-driven problem-solving, similar to the approach their consultants use with clients.
The philosophy behind this: Traditional tests can be gamed through memorization and practice. Solve assesses how candidates naturally approach novel problems. The process score captures cognitive traits that predict consulting success: structured thinking, pattern recognition, efficient information processing, and strategic decision-making.
What this means for you in practice: Think before you act. Use the built-in calculator for all math. Follow a consistent strategy. Show your work digitally. Take time during tutorials to plan your approach. Be deliberate with selections and movements.
What you should avoid: Clicking around randomly exploring options. Using external tools instead of in-game tools for anything that should be tracked. Constantly changing your mind and undoing actions. Rushing through without a strategy. Skipping thorough instruction reading.
Approach Solve like you would a real client project: understand the objective, gather relevant data systematically, analyze methodically, and present conclusions clearly. McKinsey evaluates if you think like a consultant.
You will not receive detailed scores automatically. McKinsey typically provides a simple pass or fail notification 1-2 weeks after you complete the assessment. A pass means your combined product and process scores met the threshold for your applicant pool and you’ll be invited to case interviews, assuming your resume also holds up in the deeper review. A fail means you did not meet the threshold, you’ll receive a rejection email, and you usually cannot reapply for 12 months.
McKinsey does not share score breakdowns, percentiles, or areas for improvement by default. Some candidates are able to request their decile or raw score directly from recruiting, but this only happens if you proactively ask. Because feedback is limited and you have one attempt per year, preparation matters.
The 5 Cognitive Skills McKinsey Solve Evaluates
McKinsey explicitly states that they designed Solve to test five core cognitive abilities. Understanding what these mean and how the games test them helps you prepare more effectively.
Critical thinking means making judgments based on objective analysis of information. Redrock tests this through separating relevant data from noise in research articles. Sea Wolf tests it by evaluating which microbes genuinely meet site requirements versus close matches. Ecosystem tests it through determining which species relationships are sustainable versus which will collapse. In consulting work, every day consultants receive hundreds of data points from client teams. Critical thinking means identifying the 10% that actually matters for solving the problem.
Decision-making means choosing the best course of action, especially under time pressure or with incomplete information. All games test this through strict time limits, forcing decisions with imperfect information. Sea Wolf tests it by selecting from 3 microbe options when none are perfect matches. Redrock Mini Cases test it through processing new scenarios in 2-3 minutes and choosing answers. In consulting work, client projects rarely have perfect data. You'll often need to make recommendations based on 80% of the ideal information because waiting for 100% means missing the decision window.
Metacognition means deploying appropriate strategies to tackle problems efficiently. Process score tracks whether you follow a consistent strategy, test hypotheses, and adapt approach based on results, and efficiently use tools and resources like a calculator and journal. In consulting work, strong consultants solve problems efficiently, not in any way that works. Metacognition is knowing when to use a structured framework versus when to approach a problem more creatively.
Situational awareness means the ability to interpret and subsequently predict an environment. Redrock tests this through understanding how wolf populations affect hares, which affect vegetation, which affects tourism revenue, cascading effects. Sea Wolf tests it by recognizing patterns in which microbes work well together across sites. Ecosystem tests it by predicting what happens if one species is removed from the food chain. In consulting work, when you change one variable in a business system, such as pricing, for example, what ripple effects occur across sales volume, profit margins, competitive response, and customer perception?
Systems thinking means understanding how different parts of a system influence one another. All games require this. In Ecosystem, the calorie flows link every species. In Redrock, changes in predator numbers affect herbivores, vegetation, and ultimately the economics of the region.
Sea Wolf shows how interactions among microbe attributes determine treatment effectiveness. In consulting work, business problems are never isolated. Systems thinking means seeing the full picture, how operations, finance, marketing, and technology interconnect and influence each other.
Notice what's not on this list: business acumen, industry knowledge, and financial expertise. McKinsey intentionally uses ecology-themed games because they want to test how you think, not what you already know about business. This levels the playing field. Biology major, engineer, liberal arts graduate, or MBA, everyone gets evaluated on cognitive skills. That's good news because it means anyone can prepare effectively by strengthening these five skills.
Can You Actually Prepare for McKinsey Solve?
McKinsey's official stance: "No preparation is needed for Solve. Come as you are, approach it with curiosity." Our data tells a different story: 98% of candidates who prepare with our simulation score in the top 25%, compared to an industry pass rate of 20-30%. The math is clear; preparation matters enormously.
McKinsey tells the truth when they say preparation is not required. The games do not test memorized facts or business frameworks you could study. They legitimately assess cognitive abilities. What McKinsey means: you do not need to memorize anything.
What they do not tell you: cognitive skills can be strengthened. Pattern recognition improves with practice. Time management gets better with repetition. Familiarity with the interface reduces cognitive load. While you cannot "study" for Solve like a traditional test, you absolutely can prepare.
The Prepmatter Preparation Approach
Our preparation approach rests on three simple ideas.
1. Master the mechanics.
Before test day, you should know exactly how Redrock Study and Sea Wolf work. Understand the tools, the timing, and the strategies. If you learn these during the tutorial, you burn time and mental energy you’ll need for the assessment.
2. Build the skills.
Solve tests five cognitive abilities. You strengthen these through repetition and pattern recognition, not memorisation. Redrock trains fast data processing and business math. Sea Wolf trains multi-constraint decision-making.
3. Simulate pressure.
Full 65-minute runs build stamina and expose weak points early. You want to practise Redrock and Sea Wolf together, not in isolation, because the real assessment never gives you a mental reset between games.
What to practise with Prepmatter
Your prep should revolve around completing all our Redrock and Sea Wolf scenarios.
-
Redrock Study: We currently offer 9 full scenarios, each with different data sets and question types. Working through all of them builds speed in reading exhibits, choosing relevant data, and structuring analysis.
-
Sea Wolf: The game is fully dynamic, so every run generates new microbes and site requirements. The only way to build consistency is through repetition until the pattern recognition becomes automatic.
Use this as your core practice plan regardless of whether you have 1 week or 4.
If You Have 1 Week or Less (8–12 Hours)
Day 1: Learn the games
- Watch our full walkthrough.
- Review how Redrock and Sea Wolf work and how the scoring functions.
Days 2–4: Core practice
-
Complete several Redrock scenarios.
-
Run Sea Wolf multiple times.
-
Do short daily math drills for speed.
Days 5–7: Full simulations and review
-
Take at least one full 65-minute simulation.
-
Review mistakes and revisit weak areas.
-
Keep the final day light.
If You Have More Than a Week (15–40 Hours)
Week 1: Understanding and baseline
- Watch all walkthroughs and strategy videos.
- Begin daily mental math.
- Complete your first full simulation to see where you stand.
Weeks 2–3: Skill building
-
Finish all 9 Redrock scenarios.
-
Practise Sea Wolf repeatedly until your process becomes consistent.
-
Track timing and accuracy for both games.
Final days: Simulation mastery
-
Take multiple full 65-minute simulations.
-
Practise under test-like conditions.
-
Aim for stable performance above the threshold.
Pair simulation practice with our coaching for personalized feedback
What to Practice
For Redrock Study, you need three core skills. Fast data processing means practicing reading dense articles and extracting key numbers quickly. Use business news articles as practice, read a 1,000-word article and extract the 10 most important data points in 3 minutes. Mental and business math means building speed with basic operations, percentages, and compound growth.
Our practice drills include converting between percentages and decimals, calculating percentage changes and percentage points, multi-step calculations like applying growth rate over multiple years, and weighted averages and ratios. Chart selection means knowing when to use bar charts (comparing categories), line charts (trends over time), and pie charts (parts of a whole).
For Sea Wolf, you need three different skills. Multi-variable optimization means practicing tracking multiple constraints simultaneously. You need to hold 6-9 data points in working memory, 3 attributes times 2-3 microbes, plus traits. Create your own constraint problems as practice.
Example: "Pick 3 numbers from a set of 10, where the average must be 4-6, at least one must be even, and none can be above 8." Solve these quickly to build pattern recognition. Quick arithmetic means frequently calculating averages of 3 numbers under time pressure. Practice mental math for finding averages without a calculator initially, then verify with a calculator.
Strategic decision-making means practicing making "good enough" decisions quickly rather than perfect decisions slowly. Aim for 80% optimal in half the time.
Practice Resources
Our McKinsey Solve simulation is the most realistic preparation tool available. We built our simulation to match the actual McKinsey interface as closely as possible. When you take the real assessment, nothing will feel unfamiliar.
Our Sea Wolf game is fully dynamic; every time you play, you encounter different microbes, different site requirements, and different constraints. You cannot memorize solutions. You have to build real skills.
We add 1 new Redrock scenario to our library every week. As of December 2025, we have 9+ Redrock scenarios, unlimited Sea Wolf variations, and 6+ Ecosystem scenarios for bonus practice.
After each simulation, you receive detailed feedback showing exactly which questions you answered correctly, where you lost points, and how to improve.
Current pricing: $239 for 6-month access with unlimited attempts. Right now, we're running a 50% money-back guarantee. If you do not score in the top 25% in your actual McKinsey assessment, we refund half your purchase price. Forward us your McKinsey results email to claim the refund.
98% of our simulation users score in the top 25% on the real assessment. Compare that to the industry average of 20-30% pass rate.
Start practicing with our simulation
If you're not ready to commit to paid preparation, start with our free resources. Our full Solve walkthrough runs 1 hour and 1 minute and shows complete Redrock and Sea Wolf scenarios being solved in real time, with our thinking process explained at every step. This is the single most valuable free resource available.
Our Sea Wolf deep dive runs 27 minutes with a focused tutorial on the newest game, with strategies for each of the 4 tasks. Our Redrock plus Sea Wolf update video covers what changed in July 2025 and how to adjust your preparation.
Subscribe to our YouTube channel for free tutorials
Many skills overlap between Solve and case interviews, data analysis, structured thinking, and hypothesis testing. If you're simultaneously preparing for case interviews, each strengthens the other.
Build case interview skills with Get the Offer
Dedicate 10-15 minutes daily to mental math. Speed matters as much as accuracy in Solve. Explain your Solve strategies to others through our peer practice platform. Teaching forces you to articulate your thinking, which strengthens your strategic approach.
Find practice partners on our free Peer Practice platform
Step-by-Step Strategies for Each Game
Redrock Study Strategy
Before you start, use the tutorial time wisely. It's untimed, so experiment with every tool, drag-and-drop, calculator, and journal. Test the navigation to see if you can go back and how. Read all instructions twice. Plan your time allocation. Have scratch paper and a pen ready.
Phase 1: Investigation Strategy targets 5 minutes. Start with the objective-first approach. Begin by reading the case objective clearly stated at the top. Everything else becomes noise until you understand what you're trying to solve. In our Selva Nova example, the objective was: "Analyze the impacts of the reintroduction of a predator on Selva Nova's herbivore population and vegetation coverage." That tells you exactly what data matters.
Collect all numerical constants mentioned in the text (150 wolves, 500 hares per wolf, 10% growth rate). Collect all key relationships described (If hare population stays above 500,000, vegetation decreases 3% per year). Collect all exhibit data that connects to the objective (population charts, revenue projections).
Do not collect background context that lacks numbers. Do not collect instructions you have already read. Do not collect redundant information; if a chart shows the same data as text, collect one.
Rename every data point you collect with clear, searchable labels. Default labels like "Data Point 3" are useless. Use labels like "Wolves eat 500 hares/year" or "Year 5 vegetation: with wolves."
We recommend dragging everything that looks remotely important into the journal. McKinsey tracks what you select, and while you do not want to grab everything literally, having something and not needing it beats needing it and having to go back.
Phase 2: Analysis Strategy targets 10 minutes. Read all three main questions and their sub-questions first before calculating anything. This helps you see what you're building toward and avoid duplicate work.
Use the digital calculator for everything, even simple multiplication you can do mentally. McKinsey logs your calculation process. If you show no calculator history, you lose process points.
For multi-step problems, do each step separately in the calculator rather than one long formula. If calculating population change over 3 years, calculate each year individually and show each intermediate result.
Drag every answer you calculate into the journal immediately, even if the question does not explicitly ask you to. You'll almost certainly need these numbers in the Report phase.
Common calculation types include basic arithmetic (addition, subtraction, multiplication, division), percentages (converting between percentage and decimal by dividing by 100, calculating percentage of a total), percentage points (difference between two percentages like 80% minus 65% equals 15 percentage points), growth rates (applying percentage increases over multiple periods by multiplying by 1.10 for 10% growth), and ratios and proportions (scaling up or down proportionally).
Phase 3: Report Strategy targets 5 minutes split between written and visual components. The written report section is mostly drag-and-drop. You'll fill in blanks using numbers you already calculated. The challenge comes in finding the right answer quickly in your journal; this is where good labeling in Phase 1 pays off.
For the visual report chart selection, use bar charts when comparing independent categories (vegetation cover across different regions, revenue from 3 different conservation projects). Use line charts when showing trends over time (wolf population change from year 0 to year 5, tourism revenue growth across years). Use pie charts when showing parts of a whole as percentages (budget allocation across 3 programs totaling 100%, revenue mix from different tourism activities).
Phase 4: Mini Cases Strategy uses your remaining 15 minutes at 2 to 3 minutes per case. You lack time for deep analysis. Read the question first, then skim the data to find what you need.
For word problems that give you a scenario with numbers and ask for a calculation, extract numbers, identify the operation, and calculate quickly. For formula selection that describes a situation and asks which formula applies, understand the relationship being described (growth? ratio? percentage?) and match it to the correct formula. For verbal reasoning with multiple choice asking which statement is true based on data, eliminate obviously wrong answers and check the remaining options against the data systematically. For visualization asking which chart type best represents given data, use the bar, line, and pie rules from Phase 3.
If you're stuck on a case for more than 3 minutes, make your best guess and move on.
Sea Wolf Strategy
Before you start, use the tutorial to understand the interface fully. Pay special attention to how to view microbe characteristics, how the site requirements are displayed, where to see which microbes you've already assigned, and how scoring works in 20% chunks.
Set up your tools. Have your grid paper ready. You'll be tracking multiple microbes with 3-4 characteristics each. Without organization, you'll get lost.
Task 1: Set Microbe Characteristics Strategy targets 1 minute per site for 3 minutes total. Always select 1 attribute plus 1 trait using the two-pick rule.
For choosing the attribute, pick the one with the range furthest from the midpoint of 5.5. If the site needs permeability 2-4, choose permeability because it's far from 5.5. If the site needs mobility 7-9, choose mobility because it's far from 5.5. If the site needs energy 4-6, skip energy because it's close to the midpoint, and pick a different attribute.
For choosing the trait, pick the desirable trait if shown. If both desirable and undesirable traits are shown, still prioritize the desirable because you need at least one microbe with it for the plus 20% scoring.
Task 2: Categorize Microbes Strategy targets 4 minutes per site for 12 minutes total. Use the 2-out-of-4 rule consistently.
For each microbe, check: Do 2 or more of its 3 attributes fall within site ranges? (Yes equals plus 2 points) Does it have the desirable trait? (Yes equals plus 1 point) Does it lack the undesirable trait? (No undesired trait equals plus 1 point)
If the total reaches 2 or more points and it lacks an undesirable trait, assign it to the current site. If total reaches 2 or more points but has undesirable trait AND its attributes fit next site, assign to next site. Otherwise, return it.
Task 3: Build Prospect Pool Strategy targets 3 minutes per site for 9 minutes total.
Priority 1 eliminates undesirable traits. If all 3 options have the undesirable trait, pick the one with the most attributes matching. Otherwise, never pick a microbe with an undesired trait when you have alternatives.
Priority 2 counts attribute matches. Of the remaining options, pick the microbe with the most attributes in range. Three out of three matches beats two out of three beats one out of three.
Priority 3 considers a desirable trait only when choosing between two microbes with equal attribute matches. Pick the one with a desirable trait, but only if you do not already have one in your prospect pool.
Task 4: Final Treatment Selection Strategy targets 4 minutes per site for 12 minutes total.
Step 1 eliminates microbes with an undesired trait. Cross off any microbes with the undesirable trait immediately. They cost you 20% automatically.
Step 2 identifies microbes with the desired trait. You need at least one for plus 20%. Mark these as candidates.
Step 3 finds the best attribute matches. Look for microbes where 2 or 3 attributes are already in range. Start with these.
Step 4 calculates averages. For your top candidates, calculate what their averaged attributes would be using the three-times method. Instead of calculating averages, which requires division, calculate the sum of three microbes' attributes. Then check if that sum falls within 3 times the site range.
Example: Site needs permeability 3-5. Multiply by 3 to get sum must be 9-15. Microbe A has 4, Microbe B has 5, Microbe C has 3. Sum equals 12, which falls within 9-15. This is faster than calculating 12 divided by 3 equals 4 and then checking if 4 falls within 3-5.
Step 5 optimizes your selection. If your first choice does not average within range, adjust by swapping one microbe. If the average is too low, swap in a microbe with a higher value. If the average is too high, swap in a microbe with a lower value.
Step 6 verifies scoring before submitting. Check: All 3 averaged attributes in range? (60%) At least 1 microbe has a desired trait? (20%) No microbes have an undesired trait? (20%) If all checked equals 100% effectiveness when achievable.
Do not stress if you can only achieve 80% on a site. Sometimes the available microbes prevent 100%. An 80% you're confident in beats spending 5 extra minutes chasing a maybe-impossible 100%.
What Happens After You Take McKinsey Solve
You've submitted your assessment. The screen thanks you for participating. Now what?
The standard timeline shows 1-2 weeks after completing Solve before you hear back. McKinsey's algorithms score your product and process performance. Separately, their recruiting team conducts a deeper review of your resume, more thorough than the initial screen. Both your Solve scores and resume quality determine who advances.
Variations exist: Campus recruiting cycles often have batch release dates where all candidates hear back on the same day. Off-cycle applications may have individual timelines. High-volume recruiting periods like fall MBA recruiting may take slightly longer. If you have not heard back in 2 weeks, following up politely with the recruiting coordinator is acceptable. Do not interpret silence as bad news; delays happen.
Two possible outcomes exist.
If you pass, you get an invitation to interview. McKinsey invites you to the next stage: case interviews. The email will include confirmation that you passed Solve, interview format details (virtual or in-person, how many rounds), available interview dates, preparation resources (usually links to their official case interview guide), and the deadline to schedule your interview.
This means congratulations, you've cleared the biggest hurdle. You're now in the top 20-30% of applicants. But the job is not yours yet. Case interviews require different preparation.
Next steps: Schedule interviews immediately because good time slots fill fast. Begin case interview preparation if you have not already. Prepare your fit interview stories, especially PEI for McKinsey. Research the office and practice groups you're interviewing with.
Start your case interview prep with Get the Offer.
Perfect your fit answers with our coaching
If you do not pass, you receive a rejection. McKinsey sends a polite rejection, noting that they will not be moving forward with your application at this time. Your combined Solve performance and resume did not meet the threshold for your applicant pool. This provides no specific details about where you fell short.
You can reapply, but typically not for 12 months. Some offices have 6-month waiting periods, but 12 months is standard.
What to do next: Do not take it personally, the rejection rate runs 70-80%, so you're in the majority. Use the time to strengthen your candidacy by gaining relevant experience and improving your resume. Consider applying to other consulting firms because BCG, Bain, and others have different assessment styles. If consulting is your dream, prepare thoroughly for your next attempt.
Many successful McKinsey consultants were rejected on their first attempt. The difference between success and failure often comes down to preparation and timing, not talent.
McKinsey does not share detailed score reports, percentile rankings, or feedback on how you performed in each game. You’ll only receive a pass or fail notification. Some candidates can request their decile or raw score from recruiting, but this only happens if you ask proactively. Because feedback is limited and you have one attempt per year, preparing properly before your first attempt matters.
How Prepmatter Students Pass McKinsey Solve
Over 10,000 candidates have used Prepmatter to secure offers from McKinsey, BCG, Bain, and other top firms. Sam said: "Prepmatter is the main reason I work at McKinsey. They gave me personalized sessions to identify my case interview weaknesses and built a customized plan for me to improve." Sam used both our simulation and coaching to prepare not only for Solve but for the entire recruitment process.
Mene shared: "Prepmatter was crucial in helping me land an offer at McKinsey. Without Deniz's coaching, I would not have been able to achieve this goal. Before his coaching, my case-solving skills were clearly not at the necessary level for consulting interviews." Even strong candidates benefit from structured preparation. Mene transformed from "not ready" to "offer" with the right guidance.
George told us: "Prepmatter was instrumental in securing my offer at McKinsey. I highly recommend all of Prepmatter's online and paid content, and, most of all, suggest everyone finds the time to work one-on-one with Deniz: he coached me closely for several months." Long-term preparation with multiple resources, simulation plus coaching, leads to the strongest results.
The common pattern among successful candidates: They started preparation early, not at the last minute. They used realistic simulation practice through Prepmatter or equivalent tools. They combined simulation with coaching for personalized feedback. They practiced full-length runs, not only individual games. They integrated Solve prep with broader case interview preparation.
Read all 45+ testimonials from successful candidates
You're Ready to Pass McKinsey Solve
McKinsey Solve stands between thousands of candidates and their consulting dreams every year. The good news: you now have everything you need to be in the 20-30% who advance.
You've learned what McKinsey Solve is, how it works, what changed in July 2025, how scoring works, what strategies to use for each game, and how to prepare effectively. More importantly, you understand that despite McKinsey's suggestion that no preparation is needed, the data proves otherwise; prepared candidates perform dramatically better.
Our approach focuses on building the cognitive skills McKinsey legitimately wants to see: critical thinking, systems thinking, decision-making under pressure, strategic analysis, and structured problem-solving. These are the same skills you'll use every day as a consultant.
98% of our simulation users score in the top 25% on the actual McKinsey Solve assessment. Over 1,300 candidates have used our Solve simulation, which we update continuously to reflect the latest game versions. We're confident in its effectiveness, so we offer a 50% money-back guarantee.
The difference between passing and failing McKinsey Solve, between advancing to interviews and waiting another year, often comes down to preparation. You've read this guide. You understand the assessment. Now practice.
Start practicing with our McKinsey Solve simulation. Get 6 months of unlimited access to the most realistic Redrock, Sea Wolf, and Ecosystem games available, with new scenarios added weekly. We're currently running our 50% money-back guarantee, if you do not score in the top 25% on the actual assessment, we'll refund half your purchase.
Not ready to commit? Watch our complete 1-hour walkthrough on YouTube where we solve every game in real-time and explain our thinking process.
Want personalized guidance? Our coaches, all ex-MBB consultants, can help you prepare for Solve and case interviews together.
Thousands of candidates before you felt the same anxiety you might be feeling now. They prepared, they practiced, they passed. You can too. Your McKinsey career might be only 65 minutes away.
Best of luck with your preparation.
Deniz & the Prepmatter Team
About the Author
This guide was written by Deniz, founder of Prepmatter and a former BCG consultant. Together with Doga, Deniz has coached over 700 candidates into consulting roles through Prepmatter’s structured preparation programs, maintaining a 90% success rate. Prepmatter’s McKinsey Solve videos have been viewed more than 500,000 times in the past 18 months, making them the most-watched Solve preparation content globally. Our team includes 5 former MBB consultants and professional game developers who continuously update the simulation to match McKinsey’s latest assessment versions.
Sign up for our newsletter
Join a community of aspiring consultants and elevate your preparation journey with Prepmatter.